Too many things have changed since round 2
From Apache Bench to Gatling
The ApacheBench software I initially used for round 1 and round 2 is very good to get started with.
But there are better tools that allow to have more detailed reports and insight into the load test.
Another strong reason was that ApacheBench only support HTTP/1.0. The lack of support for HTTP/1.1 may have a negative impact on performance.
Switching to Gatling gave me more flexibility and also allowed to generate pretty graphs and more detailed statistics.
This will also allow anybody with Java installed to be able to run the tests without having to install any additional software.
HTTP Headers
One of the issues pointed out by Stuart in his comment is that the response header for each container was different.
Most importantly, Grizzly was sending the least header i.e Grizzly was transmitting less data than the other 3 containers and this certainly has an impact on performance and response time.
To address this, changes have been made so that every single container is returning the very same response header.
Since Grizzly by default would not allow to add the Server HTTP header to the response, I had to implement a filter to allow for that header to be added to every response.
Now, all containers have the very same header which looks like this:
HTTP/1.1 200 OK
Server: TestServer
Content-Length: 27
Content-Type: application/json;charset=UTF-8
Date: Wed, 09 Mar 2016 18:57:19 GMT
On the other hand, with Gatling, I was also setting request headers like:
.acceptLanguageHeader("en-US,en;q=0.5")
.acceptEncodingHeader("gzip, deflate")
.userAgentHeader("Mozilla/5.0 (X11; Ubuntu; Linux x86_64; rv:44.0) Gecko/20100101 Firefox/44.0")
.acceptHeader("text/html,application/xhtml+xml,application/xml;q=0.9,*/*;q=0.8")
.connection("keep-alive")
Running the load test from a remote host
Another issue mentioned by Stuart is that ideally we want the HTTP containers being tested and the load generator to be on separate servers.
This has been addressed too.
This leads us to 2 machines in the very same Local Area Network.
HTTP containers are running on:
./sysinfo.sh
===CPU:
processor : 0
model name : Intel(R) Core(TM) i7-3537U CPU @ 2.00GHz
cpu cores : 2
processor : 1
model name : Intel(R) Core(TM) i7-3537U CPU @ 2.00GHz
cpu cores : 2
processor : 2
model name : Intel(R) Core(TM) i7-3537U CPU @ 2.00GHz
cpu cores : 2
processor : 3
model name : Intel(R) Core(TM) i7-3537U CPU @ 2.00GHz
cpu cores : 2

===RAM:
total used free shared buffers cached
Mem: 7.7G 3.0G 4.6G 323M 123M 1.4G
-/+ buffers/cache: 1.5G 6.2G
Swap: 7.9G 0B 7.9G
===Java version:
java version "1.8.0_72"
Java(TM) SE Runtime Environment (build 1.8.0_72-b15)
Java HotSpot(TM) 64-Bit Server VM (build 25.72-b15, mixed mode)

===OS:
Linux Ubuntu SMP Wed Jan 20 13:37:48 UTC 2016 x86_64 x86_64 x86_64 GNU/Linux
Gatling the load generator is runnig on
./sysinfo.sh
===CPU:
processor	: 0
model name	: Intel(R) Core(TM) i5-5250U CPU @ 1.60GHz
cpu cores	: 2
processor	: 1
model name	: Intel(R) Core(TM) i5-5250U CPU @ 1.60GHz
cpu cores	: 2
processor	: 2
model name	: Intel(R) Core(TM) i5-5250U CPU @ 1.60GHz
cpu cores	: 2
processor	: 3
model name	: Intel(R) Core(TM) i5-5250U CPU @ 1.60GHz
cpu cores	: 2

===RAM:
             total       used       free     shared    buffers     cached
Mem:           15G       1.7G        13G       367M        38M       928M
-/+ buffers/cache:       815M        14G
Swap:          15G         0B        15G
===Java version:
java version "1.8.0_74"
Java(TM) SE Runtime Environment (build 1.8.0_74-b02)
Java HotSpot(TM) 64-Bit Server VM (build 25.74-b02, mixed mode)

===OS:
Linux Ubuntu SMP Tue Sep 1 09:32:55 UTC 2015 x86_64 x86_64 x86_64 GNU/Linux
Proper warm-up
In round 1 and round 2, I was warming up the HTTP containers with a single HTTP GET request.
As suggested by Stuart, I am now doing a full 10 minute warm-up before running the real load test for 15 minutes.
Running the tests
– One need to first start the HTTP server . This can be done by following the commands on the GitHub REST-API project page
– Run Gatling: Please see the Gitub Gatling Page
The results
Compared to previous rounds, this one has shown unexpected results
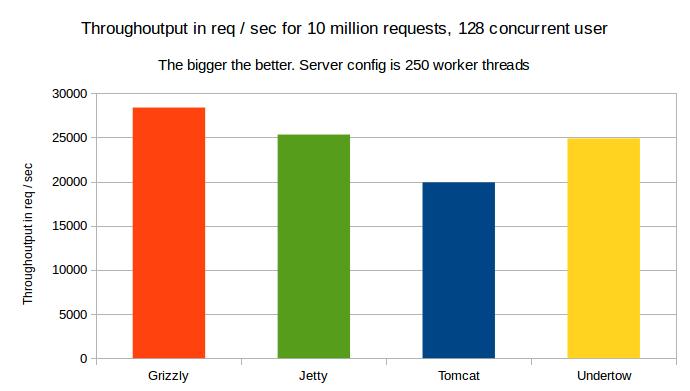
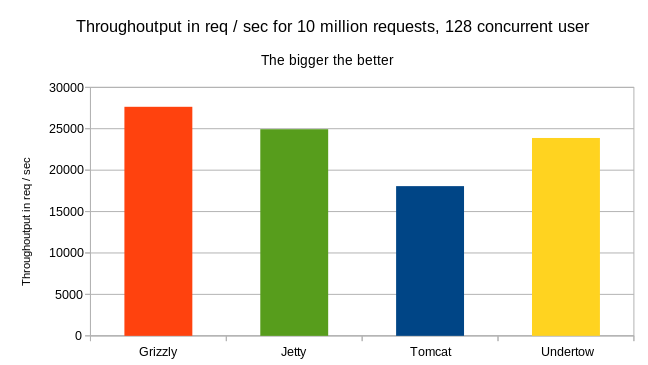
The through output:
As show on the graph, Grizzly has shown the best through output, followed by Undertow.
More detail about the bench
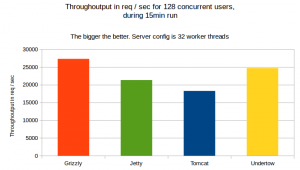
Throughoutput for a 15min run with 10min warmup and 128 concurrent users for 32 worker threads
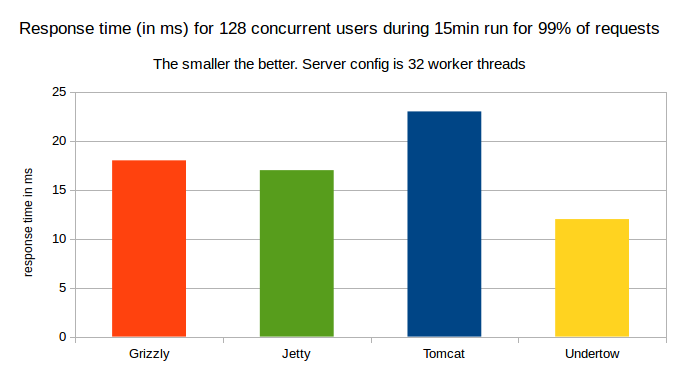
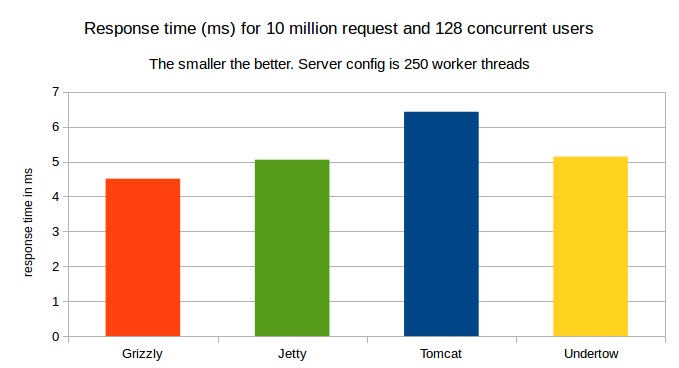
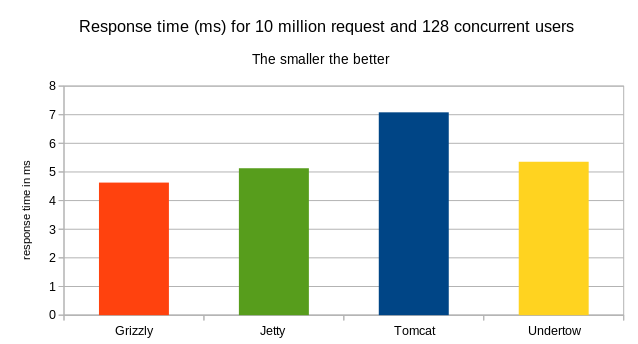
The response time
Here, we have Undertow leading in term of response time for 99% of requests.

99% of Response time in ms for 128 concurrent users for a 15minute run

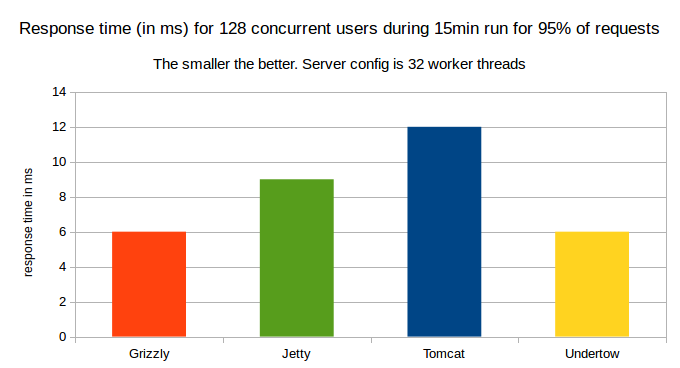
95% of Response time in ms for 128 concurrent users for a 15minute run
– When we consider 95% of responses, Undertow and Grizzly both have same 6ms response time

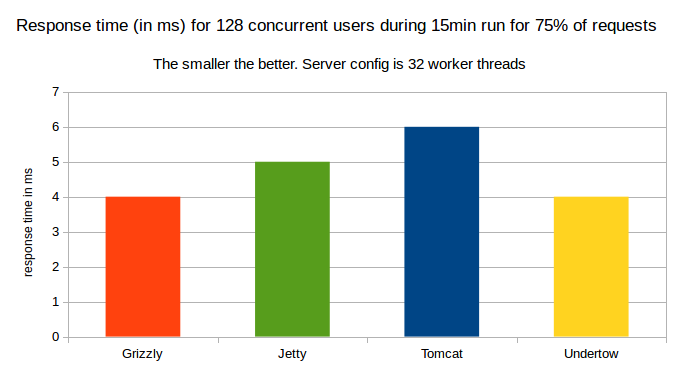
75% of Response time in ms for 128 concurrent users for a 15minute run
– When we consider 75% of response, Undertow and grizzly both have the same 4ms response time
Undertow and Grizzly have very similar performance here.
For more detail, please see the links in the resource section
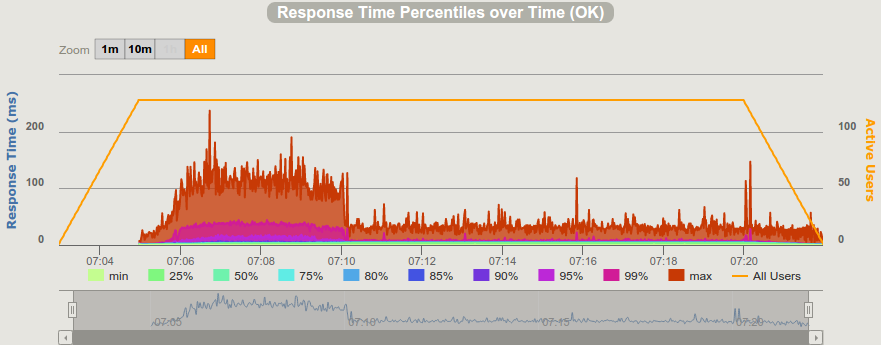
Note that Grizzly remains a very interesting beast.
For instance the detailed response time of grizzly is depicted on the following graph:
 Despite the 10 minute warm-up, the response time was still high during the first 6 minutes of the load test, then response time suddenly dropped down from above 100ms to under 30ms and remained lower… Just as if Grizzly has an internal cache.
No other container has shown such a behaviour.
Conclusion
The changes such as
– same request and response headers (Yes, size does matter here… all containers need to be returning the very same header size),
– HTTP/1.1
– proper warm-up phase, and
– running load test from remote host
have shown totally different results from what we got in round 1 and round 2.
As shown in previous tests, Grizzly seems to perform best but here, we have learnt that Undertow can come very close.
Given that Undertow is a fully blown Servlet Container with support for the latest Servlet spec, JSP, JSF etc, it is an excellent choice for complex web applications.
Resources:
More detail about the load test reports can be found at
– http://arcadius.github.io/java-rest-api-web-container-benchmark/results/round-03/grizzly/
– http://arcadius.github.io/java-rest-api-web-container-benchmark/results/round-03/jetty/
– http://arcadius.github.io/java-rest-api-web-container-benchmark/results/round-03/tomcat/
– http://arcadius.github.io/java-rest-api-web-container-benchmark/results/round-03/undertow/