Monthly Archives: December 2015

  • -

ZooKeeper: shutdown Leader! reason: Not sufficient followers synced, only synced with sids

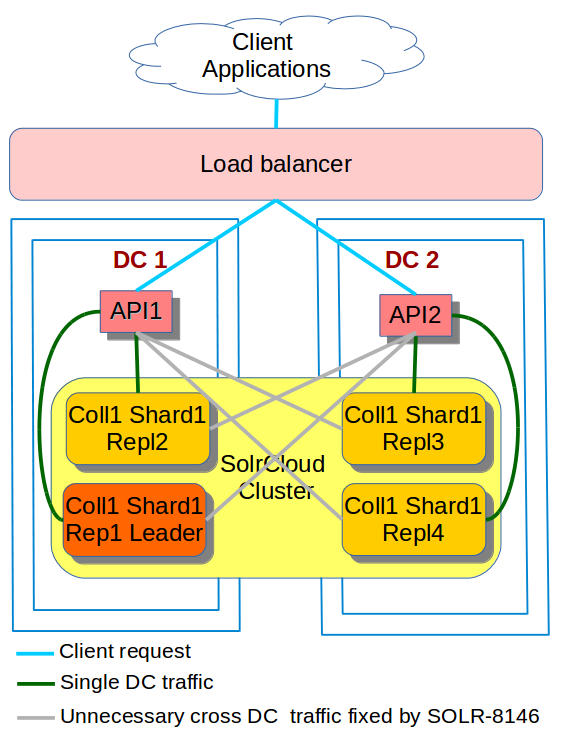
We have been running this cross DC SolrCloud cluster for over a year now and things have been working well for us.

A couple of weeks ago, In one of our non production environment, our monitoring system went mad as our ZooKeeper quorum shot itself down, leaving our SolrCloud cluster in a read-only state.zookeeper_logo

The network seemed OK and no other system was affected.

However this was a non-production system, we spent some time investigating the issue by looking in the log and the system configuration files.

The ZooKeeper Leader

The log file on the ZooKeeper leader  node showed that at the the time of the incident, we had:

[QuorumPeer[myid=K]/0.0.0.0:2181:Leader@493] - Shutting down
[myid:K] - INFO  [QuorumPeer[myid=4]/0.0.0.0:2181:Leader@499] - Shutdown called
java.lang.Exception: shutdown Leader! reason: Not sufficient followers synced, only synced with sids: [ K ]
at org.apache.zookeeper.server.quorum.Leader.shutdown(Leader.java:499)
at org.apache.zookeeper.server.quorum.Leader.lead(Leader.java:474)
at org.apache.zookeeper.server.quorum.QuorumPeer.run(QuorumPeer.java:799)

The above log entries revealed that in the allocated time (time-out T), no follower was able to sync data from the leader ZK node with myid K.
The leader (with id K not) having enough follower to maintain the quorum of 5, deliberately shot itself down.

The ZooKeeper Followers

The log entries on the followers are identical go as follow:

[myid:L] - WARN  [QuorumPeer[myid=1]/0.0.0.0:2181:Follower@89] - Exception when following the leader
java.net.SocketTimeoutException: Read timed out
at java.net.SocketInputStream.socketRead0(Native Method)
at java.net.SocketInputStream.read(SocketInputStream.java:152)
at java.net.SocketInputStream.read(SocketInputStream.java:122)
at java.io.BufferedInputStream.fill(BufferedInputStream.java:235)
at java.io.BufferedInputStream.read(BufferedInputStream.java:254)
at java.io.DataInputStream.readInt(DataInputStream.java:387)
at org.apache.jute.BinaryInputArchive.readInt(BinaryInputArchive.java:63)
at org.apache.zookeeper.server.quorum.QuorumPacket.deserialize(QuorumPacket.java:83)
at org.apache.jute.BinaryInputArchive.readRecord(BinaryInputArchive.java:103)
at org.apache.zookeeper.server.quorum.Learner.readPacket(Learner.java:153)
at org.apache.zookeeper.server.quorum.Follower.followLeader(Follower.java:85)
at org.apache.zookeeper.server.quorum.QuorumPeer.run(QuorumPeer.java:786)
[myid:L] - INFO  [QuorumPeer[myid=1]/0.0.0.0:2181:Follower@166] - shutdown called
java.lang.Exception: shutdown Follower
at org.apache.zookeeper.server.quorum.Follower.shutdown(Follower.java:166)

From the above entries, we can deduce that the followers were trying to sync data from the leaders at the same time and they threw java.net.SocketTimeoutException: Read timed out  during the allocated  time-out T

The ZooKeeper config

Now, looking at our configuration, we have among others the following lines:

tickTime=2000
initLimit=5
syncLimit=2

This means that the time-out T I was referring to in this blog is defined as

T = 2000*2= 4000ms = 4 sec

4 sec is definitely not enough for syncing SolrCloud config files data across multiple DCs.
The ZK configuration was clearly a default value that originally came with ZK and was never changed to reflect our deployment configuration


The fix

We changed the config to the one below

tickTime=4000
initLimit=30
syncLimit=15

Now, we are giving 60sec to each ZK follower node to sync data with the leader.

Other recommendations

– I would strongly recommend to read the ZooKeeper manual and understand the meaning of configuration options such as tickTime ,initLimit  and syncLimit  and check your ZK config files to make sure they are correct

– If your ZooKeeper server does not have an IPv6 address, make sure you add

-Djava.net.preferIPv4Stack=true

to your ZK start-up script. This will help avoid all sort of leader election issues (see [3] in the resources section below).

– By default, the RAM used by ZK depends on the one available the system. It’s recommended to explicitly allocate the heap size that ZK should use. This can be done by adding the following line into conf/java.env :

export JVMFLAGS="-Xms2g -Xmx2g"

You may want to change 2g to fit your need.

– It is a good idea to leave enough RAM for the OS and monitor the ZK node to make it NEVER swap!

Resources

  1. https://zookeeper.apache.org/doc/trunk/zookeeperAdmin.html#sc_configuration
  2. https://zookeeper.apache.org/doc/trunk/zookeeperAdmin.html#sc_bestPractices
  3. http://lucene.472066.n3.nabble.com/Zookeeper-Quorum-leader-election-td4227130.html
  4. https://mail-archives.apache.org/mod_mbox/zookeeper-user/201505.mbox/%3CCANLc_9+5c-4eqGNx_mbXOH3MViiuBVbMLNPP3xhafQA2xQ=POg@mail.gmail.com%3E
  5. http://www.markround.com/ ( Thanks for figuring out the IPv6 issue )


  • -

Allowing SolrJ CloudSolrClient to have preferred replica for query operations

In the previous blog post,solr-logo-on-orange-150

I discussed about how HTTP compression helped us improve solr response time and reduce network traffic in our cross DC solrCloud deployment.

In our deployment model, we have only 1 shard per collection and in term of content, all SolrCloud nodes are identical.

API and SolrCloud Traffic across two DCs

API and SolrCloud Traffic across two DCs

Let’s assume that:

  1. a request comes from the load balancer and lands on API1 in DC1,
  2. then API1 queries Solr Repl4 which is in DC2
  3. Response travels from DC2 back to API1 in DC1,
  4. the API1 finally sends response back to the client.

As stated earlier, all SolrCloud nodes have the very same content and are just replica of the same collection.

The question is: why should API1 go all the way to repl4 in DC2 to fetch data that is also available in repl1 and repl2 in DC1? There is certainly a better way.

To address this, we are proposing SOLR-8146 to the community

How it works

  1. Internally, the SolrJ client queries Zookeeper to find out the live replica of the collection being queried.
  2. SolrJ also acts as a load balancer. So, before querying Solr, SolrJ shuffles the list of replica URLs, and the first at the top of the list is used for querying. The second one is use only if the first one fails
  3. after the list is shuffled, we check whether the current request is a query operation or not
  4. If it’s a query operation, only then SOLR-8146 is applied by moving to the top of the list those URLs matching the specified Java Regular Expression . The pattern could be for instance an IP address or a port number etc.  I would recommend you check the tests in the source code of the patch at SOLR-8146

Notes

  1.  SOLR-8146 only deals with read or query operations. Any admin or update or delete operation will not be affected by the patch.
  2.  SOLR-8146 changes only the SolrJ client behaviour
  3.  SOLR-8146 comes into play if and only if the system property solr.preferredQueryNodePattern is set either by using the standard java -D  command line switch or in java  code System.setProperty()
  4. SOLR-8146 will still work no matter the number of collections deployed
  5. SOLR-8146 will still work no matter the number of shards deployed
  6. SOLR-8146 does not add to or remove nodes from the list of live solr nodes to query. it just re-order the list so that the one matching the specified pattern are first to be picked.
  7. One does not have to run SolrCloud across multiple DC in order to take advantage of SOLR-8146. There are many other use cases such as
    1. one could have a cluster running across multiple racks and prefer to have client API from rack1 talk to solr servers on rack1 only
    2. In a SolrCloud cluster, one may want one of the nodes to be used for analytics and manual slow queries or batch processing. SOLR-8146 would help keep a specific node from SolrJ queries.
    3. etc

Conclusion

SOLR-8146  brings more flexibility to the ways the SolrJ load balancer selects the nodes to query. This has many use cases.

Hopefully, it will be useful to others too.


  • -

Deploying SolrCloud across multiple Data Centers (DC): Performance

After deploying our search platform across multiple DCs deployment, we load tested the Search API.

We were not too impressed by the initial result.

We had issues like:
– high response time,
– high network traffic,
– long running queries.

After investigation, it turned out that a large amount of search result was being transferred between the SolrCloud nodes and the search API.

This is because clients were requesting a large number of documents.
It turned out that this was a business requirement and we could not put a cap on this.

HTTP compression to the rescue

Solr supports HTTP compression. This support is provided by the underlying Jetty Servlet Container.

To enable HTTP compression for Solr, two steps are required:

  1. Server Configuration

    To configure Solr 5 for HTTP compression, one needs to edit the file
    server/contexts/solr-jetty-context.xml by adding before the closing </config> the following XML snippet:

    
            org.eclipse.jetty.servlets.GzipFilter
            /*


                mimetypes
                text/html,text/xml,text/plain,text/css,text/javascript,text/json,application/x-javascript,application/javascript,application/json,application/xml,application/xml+xhtml,image/svg+xml
            
            
                methods
                GET,POST


    The next step is to set the gzip header on the client.

  2. Client Configuration

    The SolrJ client needs to send the HTTP header Accept-Encoding: gzip, deflate to the server. Only then, will the server respond with compressed data.
    To achieve this, org.apache.solr.client.solrj.impl.HttpClientUtil utility class is being used:

    DefaultHttpClient httpClient = (DefaultHttpClient) cloudSolrClient.getLbClient().getHttpClient();
    HttpClientUtil.setAllowCompression(httpClient, true);
    HttpClientUtil.setMaxConnections(httpClient, maxTotalConnections);
    HttpClientUtil.setMaxConnectionsPerHost(httpClient, defaultMaxConnectionsPerRoute);
    HttpClientUtil.setSoTimeout(httpClient, readTimeout);
    HttpClientUtil.setConnectionTimeout(httpClient, connectTimeout);
    

    Note that in the code above we not only enable compression on the client, but we also set soTimeout and connectionTimeout on the client.

  3. The result

    1. Before enabling compression, we were doing in total in term of network traffic 12000KB/sec
    2. After changes, we dropped to 3000KB/s, that is serving just 25% of the original traffic, in other words, a drop of 75% of the network traffic!
    3. We have also seen a drop in response time by more than 60%!
    4. There is a price to pay for all of this: we have noticed a slight increase in CPU usage

Conclusion

However HTTP compression can be very beneficial when serving large response, it is not always the answer.
If possible, it’s better to serve small responses (for instance 10-40 items/pages).

In the next blog, I will share some of the challenges we have been facing.